This article discusses the importance of power quality (PQ) measurements in today’s electric infrastructure and reviews areas of application for PQ monitoring. It will cover the IEC standard for power quality and its parameters. Finally, it summarizes the key differences between Class A and Class S power quality meters.
This article also explains how to efficiently design a standards-compliant PQ measurement instrument using a ready-to-use platform that accelerates development. It will discuss different solutions for designing a Class A and Class S meter, including a new Class S power quality measurement integrated solution that significantly reduces the development time and costs for power quality monitoring products.
Power quality has found a renewed interest due to changing power generation modes and consumption dynamics. The unprecedented growth in renewable sources at different voltage levels has increased the amount of PQ-related issues. Consumption patterns have also seen a wide transformation due to unsynchronized loads added at multiple entry points of the grid and voltage levels. Some examples are electric vehicle (EV) chargers that can require hundreds of kilowatts and a great number of data centers and their related equipment such as heating, ventilation, and air conditioning. In industrial applications, arc furnaces that run by variable frequency drives, switching transformers, etc. not only add a lot of unwanted harmonics to the grid, but are also responsible for voltage dips, swells, transient brownouts, and flicker.
Power quality in the utility space refers to the quality of the voltage delivered to the consumer; a series of prescribed regulations for the magnitude, phase, and frequency determine this quality of service. However, by definition, it denotes both voltage and current. While the voltage is easily controlled by the generation side, the current is governed largely by consumer usage. The concept and implications of PQ issues are rather widespread depending on the end users.
The economic impact of bad PQ has been studied and surveyed extensively in the last few years; its effects are estimated to be in the region of billions of dollars worldwide. All these studies conclude that monitoring the quality of power has a direct impact on the economic results of many business sectors. Even though it is clear how bad PQ negatively affects the economics of business, monitoring it efficiently and effectively at scale is not an easy task. Monitoring PQ in a facility involves having highly trained personnel and expensive equipment installed on multiple points along the electric system for long or indefinite periods of time.
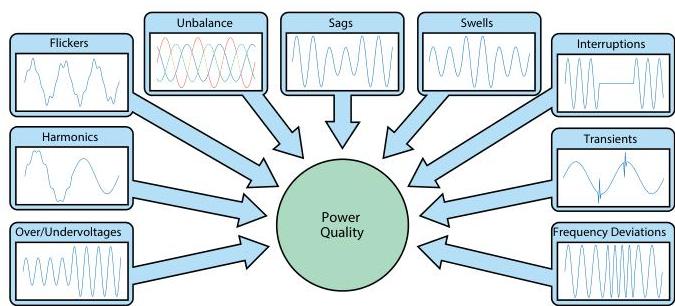
Figure 1. Power quality issues.

Figure 2. The dynamics of generation and consumption can lead to power quality issues across electric infrastructure.
Power quality monitoring is often seen as a cost saving strategy for some business sectors and a critical activity for others. Power quality issues can arise in a broad range of electric infrastructure, as illustrated in Figure 2. As we’ll discuss later, power quality monitoring is becoming increasingly critical in business sectors such as electric generation and distribution, EV charging, factories, and data centers.
Utility companies serve the consumers with distribution systems that include generating stations, which are power substations that supply electricity via transmission lines. The voltage supplied via these transmission lines is stepped down to lower levels by substation transformers, which inject certain harmonics or interharmonics to the system. Harmonic currents in distribution systems can cause harmonic distortion, low power factor, and additional losses as well as overheating in the electrical equipment, leading to a reduction in the lifetime of equipment and increases in cooling costs. Nonlinear single-phase loads served by these substation transformers deform the current’s waveform. The unbalance of nonlinear loads leads to additional losses on power transformers, additional load of neutrals, unexpected operation of low-power circuit breakers, and incorrect measurement of electricity consumed. Figure 3 illustrates the effect of these linear loads.

Figure 3. The impact of current harmonics generated by a nonlinear load.
Electricity generation by wind and photovoltaic (PV) solar systems injected into the grid cause several power quality problems as well. On the wind generation side, wind intermittency creates harmonics and short-duration voltage variations. The inverters in PV solar systems create noise that can produce voltage transients, distorted harmonics, and radio frequency noise because of the high speed switching commonly used to increase the efficiency of the energy harvested.
EV chargers can face multiple power quality challenges, both in power sent to and from the grid (see Figure 4). From a power distribution company perspective, power electronics-based converters used in EV chargers inject harmonics and interharmonics. Chargers with improperly designed power converters can inject direct currents (DC). Additionally, fast EV chargers introduce rapid voltage changes and voltage flicker into the grid. From the EV charger side, faults in transmission or distribution systems lead to voltage dips or interruption of supply voltage to the charger. Reduction of voltage from the EV charger tolerance limits will lead to activation of undervoltage protection and disconnection from the grid (which leads to a very bad user experience).

Figure 4. Power quality issues for EV chargers.
Power quality problems caused by power supply variations and voltage disturbances, cost approximately $119 billion (U.S.) per year for industrial facilities in the United States, as per an Electric Power Research Institute (EPRI) report. Additionally, 25 EU states suffer an equivalent of $160 billion (U.S.) in financial losses per year due to different PQ issues, according to the European Copper Institute. These figures are linked to subsequent downtime and production losses as well as the equivalent of intellectual productivity losses.
Degradation of power quality is usually caused by intermittent loads and load variations from arc furnaces and industrial motors. Such disturbances give rise to surges, dips, harmonic distortions, interruptions, flicker, and signaling voltages. To detect and record these disturbances inside a factory installation, it is necessary to have power quality monitoring equipment in several points throughout the electric installation or, even better, have it at the load level. With the arrival of new Industry 4.0 technologies, power quality monitoring at the load can be addressed by industrial panel meters or submeters to have a comprehensive view of the quality of the power delivered to each load.
Presently, most business activities depend on data centers in one way or another to provide email, data storage, cloud services, etc. Data centers demand a high level of clean, reliable, and uninterrupted electricity supply. PQ monitoring excellence helps managers prevent costly outages and helps manage equipment maintenance, or replacement, required due to issues on the power supply units (PSU). The integration of uninterrupted power supply (UPS) systems into rack power distribution units (PDUs) represents another reason to add PQ monitoring to IT racks inside the data center.
This integration can provide visibility to power issues at a power socket level.
UPS system failure, including UPS and batteries, is the primary cause of unplanned data center outages according to a report made by Emerson Network Power. Around a third of all reported outages cost companies nearly $250,000.
UPS systems are used on every data center to ensure clean and uninterrupted power. These systems isolate and mitigate most of the power problems from the utility side, but they do not protect against issues generated by the PSU of IT equipment itself. IT equipment PSUs are nonlinear loads that can introduce harmonic distortion in addition to other problems caused by equipment such as those that can result in high-density cooling systems with variable frequency speed-controlled fans. Apart from these issues, PSUs also face interferences that come in multiple forms such as voltage transients and surges, voltage swells, sags, and spikes, imbalance or fluctuations, frequency variation, and poor facility grounding.
Power quality standards specify measurable limits to the electricity magnitudes as to how far they can deviate from a nominal specified value. Different standards apply to different components of the electricity system. Specifically, the International Electrotechnical Commission (IEC) defines the methods for measurement and the interpretation of results of PQ parameters of alternating current (AC) power systems in the IEC 61000-4-30 standard. The PQ parameters are declared for fundamental frequencies of 50 Hz and 60 Hz. This standard also establishes two classes for measurement devices: Class A and Class S.
Class A defines the highest level of accuracy and precision for the measurements of PQ parameters and is used for instruments requiring very precise measurements for contractual matters and dispute resolution. It is also applicable to the devices that need to verify compliance of the standard.
Class S is used for power quality assessment, statistical analysis applications, and diagnostics of power quality problems with low uncertainty. The instrument in this class can report a limited subset of the parameters defined by the standard. The measurements made with Class S instruments can be done on several sites on a network, on complete locations or even on single pieces of equipment.
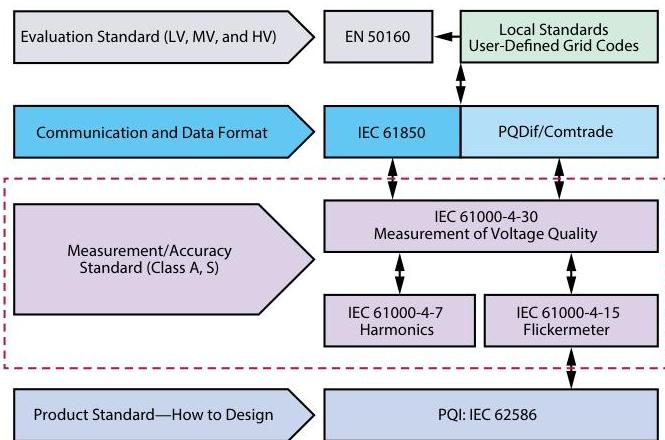
Figure 5. IEC power quality standards.
It is important to note that the standard defines the measurement methods, establishes a guide for the interpretation of the results, and specifies the performance of the power quality meter. It does not give guidelines on the design for the instrument itself.
The IEC 61000-4-30 standard defines the following PQ parameters for Class A and Class S measurement devices:
Although Class A defines higher levels of accuracy and precision than Class S, the differences are beyond just levels of accuracy. Instruments must comply with requirements such as time synchronization, quality of probes, calibration period, temperature ranges, etc. Table 1 presents a list of requirements that instruments shall meet to be certified in one or the other class.

Figure 6. Classification of power quality parameters in a timescale.
Table 1. IEC 61000-4-30 Class A and Class S Key Differences.
| Class A | Class S | |
|---|---|---|
| Voltage Measurement Accuracy | ±0.1% | ±0.5% |
| Current Measurement Accuracy | ±1% | ±2% |
| Voltage and Current rms Calculation | Half-cycle steps | One-cycle steps |
| Frequency Measurement Accuracy | ±10 mHz | ±50 mHz |
| 150/180-Cycle Aggregation | No gaps permitted, synchronized with UTC 10 min tick | Gaps between aggregations allowed |
| Measurements of Harmonics up to Order | 50th | 40th |
| Time-Clock Uncertainty per 24 Hours | ±1 second | ±5 seconds |
| Time Synchronization | GPS receiver, radio timing signals or network timing signals | Not required |
| Operation Temperature Range | 0°C to 45°C | Specified by manufacturer |
The basic components of an instrument designed for power quality measurement are shown in Figure 7. First, the current and voltage transducers must account for the operational range of the instrument and adapt the input signal to the dynamics of the analog-to-digital converter (ADC) input. Traditional transducers are the first source of uncertainty in the measurement; therefore, correct selection is of great importance. Next, the signal goes to an ADC; its individual characteristics such as offset, gain, and nonlinearity errors create a second source of uncertainty. Selecting the correct ADC for this function is a demanding effort for designing a power quality instrument. Lastly, a series of signal processing algorithms must be produced to get electrical and power quality measurements from the input signals.

Figure 7. The main components of an instrument for power quality measurements.
Table 2. Accuracy Requirements for Current, Voltage, and Power Measurements Specified by IEC 61000-4-7 Standard.
| Class | Measurement | Conditions | Maximum Error |
|---|---|---|---|
| A | Voltage | U_M >= 1% U_NOM | ±5% U_M |
| U_M < 1% U_NOM | ±0.05% U_NOM | ||
| Current | I_M >= 3% I_NOM | ±5% I_M | |
| I_M < 3% I_NOM | ±0.15% I_NOM | ||
| Power | P_M >= 150 W | ±1% P_M | |
| P_M < 150 W | ±1.5 W | ||
| S | Voltage | U_M >= 3% U_NOM | ±5% U_M |
| U_M < 3% U_NOM | ±0.15% U_NOM | ||
| Current | I_M >= 10% I_NOM | ±5% I_M | |
| I_M < 10% I_NOM | ±0.15% I_NOM |
I_NOM: Nominal current range of the measurement instrument
U_NOM: Nominal voltage range of the measurement instrument
U_M, I_M, and P_M: Measured values
Depending on the location and application of the power quality instrument, the nominal supply voltage (U_NOM), nominal current (I_NOM), and frequency varies. Independently of the nominal values that the instrument measures, the IEC 61000-4-7 standard requires power quality measurement instruments to reach the accuracies presented in Table 2; therefore, the transducers must be selected such that the instrument fulfills the accuracy requirements.
The IEC 61000-4-7 standard recommends designing the input circuitry following these nominal voltages (U_NOM) and nominal currents (I_NOM):
Additionally, the transducers selected for measuring voltage and current must keep their characteristics and accuracy unchanged when a 1.2x U_NOM and I_NOM are applied continuously. A signal four times the nominal voltage or 1 kV rms, whichever is less, applied for 1 second to the instrument must not lead to any damage. Likewise, a 10x I_NOM current for 1 second shall not produce any damage.
Even though the IEC 61000-4-30 standard does not specify a minimum requirement for sampling rate, the ADC must have enough sampling rate to measure some oscillatory and fast power quality phenomena. An insufficient sampling rate could result in the misclassification of a power quality event or the failure to detect one. The IEC 61000-4-30 standard states that the instrument voltage and current sensors should be appropriate for up to 9 kHz. Thus, the sampling frequency of the ADC must be selected following the rules of signal analysis to perform a measurement of frequency components up to 9 kHz included. Figure 8 illustrates the consequences of when the sampling rate is not sufficient. The top left waveform contains 64 samples per 10 cycles (200 ms) and the top right waveform has 1024 samples per 10 cycles. As shown in Figure 8, the top left graph shows a voltage dip event while the top right graph shows that the dip is transient induced.
The IEC standard applies to single-phase and three-phase systems; therefore, the selected ADC must be able to sample the required number of voltage and current channels simultaneously. Having measurements for all the voltage and current channels on the instrument at the same time allows all parameters to be examined and immediately triggered when a power quality event occurs.
Even though selecting the transducers and ADC for power quality measurements requires a comprehensive engineering effort, developing the algorithms for processing the raw ADC measurements is undoubtedly the task that demands most of the time and resources to make a power quality instrument. To implement a standard compliant instrument, the right DSP hardware must be chosen and the algorithms to calculate the power quality parameters from the waveform samples have to be developed and properly tested. The standard not only requires calculations but also different time-dependent aggregations with time accuracies less than ±1 seconds per 24-hour period for Class A and ±5 seconds per 24-hour period for Class S. These algorithms must perform harmonic analysis. Additionally, power quality parameters rely on fast Fourier transform (FFT) analysis (harmonics, interharmonics, mains signaling voltage, unbalance), which are challenging to implement.
The FFT analysis requires the waveforms to be sampled at 1024 samples per 200 ms (10 cycles) minimum. Performing resampling of the raw waveforms from the ADC to the required rate requires care to avoid harmonic distortion and aliasing. After the algorithms are developed, the IEC standard requires a comprehensive list of more than 400 tests that the instrument must pass to be fully certified. Figure 9 shows a block diagram with the most relevant functions a DSP system needs for producing power quality measurements.

Figure 8. ADC sampling rate effect on power quality measures.

Figure 9. Block diagram: relevant functions of a DSP power quality system.
Considering the accuracy, number of channels, and sampling rate requirements to develop a Class A PQ instrument, the AD777x and AD7606x family of products are recommended for the ADC conversion of the signal chain/system. Note that these solutions provide just the raw digitized data from the input signals. A DSP system must be developed to get certified PQ measurements.
The AD777x is an 8-channel, 24-bit simultaneous sampling ADC family of devices. Eight full sigma-delta ADCs are on-chip providing sampling rates of 16 kSPS/32 kSPS/128 kSPS. The AD777x provides a low input current to allow direct sensor connection. Each input channel has a programmable gain stage allowing gains of 1, 2, 4, and 8 to map lower amplitude sensor outputs into the full-scale ADC input range, maximizing the dynamic range of the signal chain. The AD777x accepts a V_REF voltage from 1 V up to 3.6 V and analog input range: 0 V to 2.5 V or ±1.25 V. The analog inputs can be configured to accept true differential, pseudo differential, or single-ended signals to match different sensor output configurations. A sample rate converter is provided to allow fine resolution control over the AD7770 and it can be used in applications where the ODR resolution is required to maintain coherency with 0.01 Hz changes in the line frequency. The AD777x also provides large signal input bandwidth 5 kHz (AD7771 10 kHz). A data output and SPI communications interfaces are provided although the SPI can also be configured to output the sigma-delta conversion data. The temperature range is from -40°C to +105°C, functional up to +125°C with a power supply of 3.3 V or ±1.65 V.
Figure 10 shows a 3-phase typical applications system diagram for the AD777x family of ADCs for a PQ instrument using current transformers as current transducers and resistor dividers for voltage.
The AD7606x provides a 16-/18-bit, simultaneous sampling, analog-to-digital data acquisition system (DAS) with eight channels. Each channel contains analog input clamp protection, a programmable gain amplifier (PGA), a low-pass filter, and a 16-/18-bit successive approximation register (SAR) ADC. The AD7606x also contains a flexible digital filter, low drift, 2.5 V precision reference and reference buffer to drive the ADC, and flexible parallel and serial interfaces.
The AD7606B operates from a single 5 V supply and accommodates ±10 V, ±5 V, and ±2.5 V true bipolar input ranges when sampling at throughput rates of 800 kSPS (AD7606B)/1 MSPS (AD7606C) for all channels. The input clamp protection tolerates different voltages with user selectable analog input ranges (±20 V, ±12.5 V, ±10 V, ±5 V, and ±2.5 V). The AD7606x requires a single 5 V analog supply. The single-supply operation, on-chip filtering, and high input impedance eliminate the need for external driver op amps, which require bipolar supplies. In software mode, the following advanced features are available:
Figure 10 shows a 3-phase typical applications system diagram for the AD7606x family of ADCs for a power quality instrument using current transformers as current transducers and resistor dividers for voltage.

Figure 10. A power quality 3-phase applications system diagram for the AD777x and AD7606x families of ADCs.
The ADE9430, a highly accurate, fully integrated, polyphase energy metering IC combined with the ADSW-PQ-CLS software library running on a host microcontroller, is a complete solution that is IEC 61000-4-30 Class S standard compliant. This integration significantly reduces the development time and costs for PQ monitoring products. The ADE9430 + ADSW-PQ-CLS solution simplifies the implementation and certification of energy and PQ monitoring systems by providing a tight integration of acquisition and calculation engines. Figure 11 shows a 3-phase applications system diagram for the ADE9430 + ADSW-PQ-CLS solution for a power quality instrument using current transformers as current transducers and resistor dividers for voltage.
With seven input channels, the ADE9430 can be used on a 3-phase system or up to three single-phase systems. It supports current transformers (CTs) or Rogowski coils with an external analog integrator for current measurements. It provides an integrated analog front end for power quality monitoring and energy measurement.
The ADE9430 is pin-compatible with the ADE9000 and ADE9078 with equivalent analog and metrology performance. Its features include:
The ADSW-PQ-CLS software library is designed specifically to be integrated with the ADE9430 to generate standard compliant IEC 61000-4-30 Class S PQ measurements. It implements all parameters defined in IEC 61000-4-30 for Class S instruments. Users can decide which PQ parameters to use. This library needs low CPU/RAM resources and is core/OS agnostic (Arm Cortex-M minimum). Supported MCU architectures include Arm Cortex-M0, Cortex-M0+, Cortex-M1, Cortex-M3, and Cortex-M4. For distribution to end users, the library is provided as a CMSIS-PACK file (.pack) compatible with Keil Microvision, IAR Embedded Workbench version 8.x, or Analog Devices CrossCore Embedded Studio. The license for software library is included with the purchase of the ADE9430. A PC serial command line interface (CLI) example is provided to evaluate the library and its features. Figure 12 shows how PQ parameters are displayed by this CLI.

Figure 11. An ADE9430 and ADSW-PQ-CLS PQ 3-phase system diagram.

Figure 12. ADSW-PQ-CLS software library serial CLI interface.
Table 3. Energy and Power Quality features of the ADE9xxx Family of Energy Metering ICs; Class S Value Indicates Feature Is Standards Compliant with IEC 61000-4-30 Class S.
| Parameter | ADE9078 Utility Metering | ADE9000 Power Quality | ADE9430 + ADSW-PQ-CLS |
|---|---|---|---|
| Watt, Watt-hr | Yes | Yes | Yes |
| I rms, V rms, VA, VA-hr | Yes | Yes | Yes |
| Total VAR, VAR-hr | Yes | Yes | Yes |
| Fundamental VAR, VAR-hr | Yes | Yes | Yes |
| Power Factor | Yes | Yes | Yes |
| Current Phase Angle | Yes | Yes | Yes |
| Voltage Phase Angle | Yes | Yes | Yes |
| Line Frequency-Three | Yes | Yes | Class S |
| Phase Sequence Detection | Yes | Yes | Yes |
| 1/2 Cycle rms | – | Yes | – |
| 1 Cycle rms | – | Yes | Class S |
| 10/12 Cycle rms | – | Yes | Class S |
| 150/180 Cycle rms | – | – | Class S |
| Dip/Swell | – | Yes | Class S |
| Interruptions | – | – | Class S |
| Overcurrent | – | Yes | Yes |
| Fundamental Watt, Watt-hr, VA, VA-hr | – | Yes | Yes |
| Rapid Voltage Change | – | – | Class S |
| Over/Under Deviation | – | – | Class S |
| Flicker | – | – | Class S |
| Voltage/Current Unbalance | – | – | Class S |
| Voltage/Current Harmonics, Interharmonics | – | – | Class S up to 40th |
| ITHD, VTHD | – | Yes | Class S |
| Mains Signaling Voltage | – | – | Class S (<3 kHz) |
| Fundamental I rms, V rms | – | Yes | Yes |
| Data Rate | 16 kSPS/4 kSPS | 32 kSPS/8 kSPS | 32 kSPS/8 kSPS |
| Resampled Data | 64 pts/cycle | 128 pts/cycle | 128 pts/cycle or 1024 pts (10/12 cycles) |
| Maximum SPI Frequency | 10 MHz | 20 MHz | 20 MHz |
The EVAL-ADE9430ARDZ enables quick evaluation and prototyping of energy and Class S power quality measurement systems with the ADE9430 and the ADSW-PQ-CLS Power Quality Library. The power quality library and application example are provided to simplify implementation of larger systems. This kit provides a plug and play type of experience that is easy to use to test the power quality parameters of a 3-phase electrical system.
The kit has the following hardware features:
Figure 13 shows the connections required to use the EVAL-ADE9430ARDZ with a PC.
The EVAL-ADE9430ARDZ consists of a PCB with four current and three voltages + neutral input connectors and on-board ADE9430, isolators, a real-time clock, a Cortex-M4 STM NUCLEO-413ZH development board with an example application of the ADSW-PQ-CLS library, and three current sensors.

Figure 13. A diagram of the EVAL-ADE9430ARDZ connected to a PC.
The ADE9430 + ADSW-PQ-CLS solution has been certified to accurately measure power quality parameters following the requirements of the IEC 61000-4-30 Class S standard.
Power quality issues are present across the whole electric infrastructure. Having equipment that monitors these PQ issues helps to improve performance, quality of service, and equipment lifetime while reducing economic losses. In the subsequent article “How to Design a Standards Compliant Power Quality Meter,” we will introduce an integrated solution and a ready to use platform that can significantly accelerate development and reduce costs for developing PQ monitoring products.
Designing a standards compliant power quality meter is a challenging task. To reduce the time and engineering resources needed to produce an IEC 61000-4-30 Class S standard compliant PQ measurement instrument, the ADE9430 + ADSW-PQ-CLS is a complete go-to solution that enables designers with a ready to use platform to accelerate development and solve for many critical design challenges.
Jose Mendia has a B.Sc. in electronics and computer science engineering and joined the Energy and Industrial System Group at Analog Devices in 2016. Currently he is a senior engineer in product applications at the Edinburgh UK design center.