An analog sensor produces an output signal that varies in a known way as a function of the physical property being sensed. Depending on the type of analog sensor, the output signal may be a voltage, current, frequency, phase, etc. This application note provides two examples of acquiring data from analog sensors using a microcontroller (MCU) with an internal Analog-to-Digital Converter (ADC) peripheral. The first example demonstrates the use of a Resistance Temperature Detector (RTD) to measure temperature. The second example demonstrates current measurement in a circuit using a sense resistor. Both examples utilize techniques for minimizing power consumption.
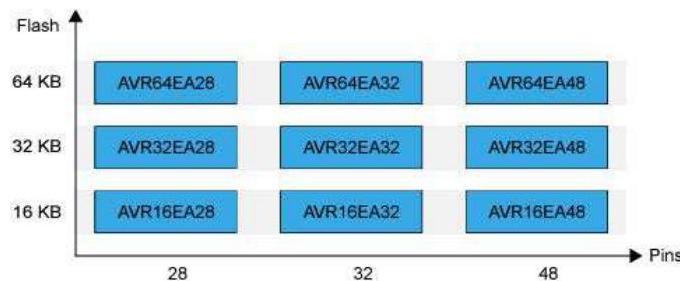
This section lists the relevant devices for this document. The following figures show the different family devices, laying out pin count variants and memory sizes:
Figure 1. AVR EA Family Overview
Many systems include one or more analog sensors that periodically must be checked. Analog sensors that generate voltage or current outputs are quite common. These signals can be measured using a microcontroller’s Analog-to-Digital Converter (ADC) peripheral. In battery-powered systems, it is crucial to minimize power consumption using techniques such as placing the microcontroller in a sleep mode between measurements.
This application note describes two examples of low-power analog sensor measurements using the AVR EA family of microcontrollers. The first example demonstrates the use of a Resistance Temperature Detector (RTD) to measure temperature. The second example shows current measurement in a circuit using a sense resistor.
In this example, the AVR EA microcontroller is used to periodically drive a Resistance Temperature Detector (RTD) with current, measure the voltage across the RTD, and calculate both resistance and temperature of the RTD. The only hardware needed in addition to the microcontroller is a 1.8 kOhm fixed resistor and the RTD itself. The type of RTD used is a Pt100, meaning that it is made of platinum and has a resistance of 100 Ohm at 0 deg C.
The figure below is a high-level hardware block diagram showing the peripherals and components used in the RTD measurement and how they are connected.

To measure the RTD, the Digital-to-Analog Converter (DAC) is enabled to produce an output of approximately 1.8V. The DAC on AVR EA is buffered so it can drive low-impedance loads. Since the DAC voltage is applied to a 1.8 kOhm fixed resistor in series with the RTD, the current flowing through the RTD will be under 1 mA. RTD datasheets usually provide guidance for maximum current, but generally, a current of less than 1 mA is recommended because it prevents the RTD from any significant self-heating. The ADC is used to measure the voltage across the RTD, which can be converted into the sensor resistance and thus, its temperature.
The resistance of the RTD varies in a known way as a function of temperature (T), by the following equations, where R0 is the resistance of the RTD at a temperature of 0 deg C and A, B and C are constants provided by the RTD manufacturer:
For T of 0 deg C or higher,
For T of -200 deg C to 0 deg C,
If the resistance of the RTD is known, then the formulas above can be used to determine the temperature. Here are the relevant formulas for determining the resistance of the RTD:
First, the voltage across the RTD is determined by the voltage divider equation, where R_F is the resistance of the fixed resistor and R_TD is the resistance of the RTD:
The ADC digital result x, when the ADC is used in differential mode, is determined by the following equation (from the device datasheet), where G_PGA is the gain of the PGA:
The voltage divider equation from above can be substituted in for V_RTD, causing V_REF to cancel out:
This equation can be solved for R_TD, the resistance of the RTD:
Note that V_REF does not appear in the equation, so errors in the reference voltage value will not affect the result. The only parameters needed to compute the RTD resistance are the resistance value of the fixed resistor, the ADC result, and the PGA gain value.
Hardware connections are as follows:

MPLAB version:
MCC Core v5.5.0 or newer
Microchip Studio for AVR and SAM Devices v7.0.2542 or newer
For debugging purposes, it can be helpful to install the MPLAB Data Visualizer:
To minimize power consumption, the AVR EA is configured to stay in Power-Down sleep mode whenever a measurement is not in progress. In this sleep mode, AVR EA consumption was measured as approximately 0.9 uA (with V_DD = 3.3V). The PIT (Periodic Interrupt Timer), a part of the RTC (Real Time Counter), is set up to periodically generate an interrupt to bring the device out of sleep mode.
When this happens, the DAC is enabled to produce an output voltage of 1.8V, and the ADC is re-enabled. The ADC is commanded to start a differential conversion immediately. While the ADC conversion is in progress, the CPU performs the calculations necessary for converting the previous ADC value into resistance and temperature. As soon as the ADC conversion is complete and the result is saved, DAC and ADC are disabled, and the device is put back to sleep.
The DAC and ADC are enabled after the device comes out of sleep. The DAC output stabilizes before the ADC is ready to start its first conversion, so there is no need for additional delays in the software.
Various strategies were tested to minimize power consumption (higher/lower CPU and ADC clock speeds, PGA on/off with less/more conversions). But in this case, the overriding issue is the fact that the DAC must supply nearly 1 mA of current to the RTD sensor while AD conversions are in progress. Therefore the best strategy is to run both the CPU and ADC as fast as possible (10 MHz and 5 MHz clocks, respectively) with maximum PGA gain so the time that the DAC must supply 1 mA is minimized. During the Power-Down Sleep mode, the 10 MHz clock source is disabled, and only the internal 32 kHz oscillator and the RTC clock source are running. With this configuration, a burst of 16 ADC conversions takes only 155 us.
During that 155 microseconds of conversion time with DAC enabled, the microcontroller supply current measured 4.7 mA (this includes what the DAC needed to drive the RTD, with V_DD = 3.3V). If there is one conversion per second, the average current will be (155 us/1s) x 4.7 mA = 1.55e-4 x 4.7 mA = 0.73 uA.
Average current consumption is thus expected to be the sleep current of 0.9 uA + (0.73 uA) x n, where n is the number of RTD temperature measurements per second:
| n | Measured Average Current Consumption (with V_DD = 3.3V) |
|---|---|
| 2 per second | 2.4 uA |
| 4 per second | 3.7 uA |
| 8 per second | 6.6 uA |
| 16 per second | 12 uA |
| 32 per second | 24 uA |
| 64 per second | 47 uA |
The key peripherals and parameters used in the source code are:
The following figure shows the high-level flow of the code:

Figure 2. High-level flow of voltage sensing code
Some analog sensors, for example photodiodes and phototransistors, generate a current output. It may also be interesting to measure the current at a point in a circuit. In this example, the AVR EA microcontroller periodically measures a current using its internal ADC peripheral. Because the ADC can only sample a voltage, the current is sent through a “sense” resistor with a known resistance value to convert the current to a voltage. The current can then be calculated from the measured voltage.
This example uses the following hardware configuration to measure the current:

This example uses the following values:
The DAC is used to create a current source. Although the DAC outputs a voltage signal V_0, the resistors in the circuit will create a current I_0 that is given by:
The voltage divider rule gives the following equation for the voltage drop across R_SENSE:
If the expression for I_0 is substituted (the same current flows through all the resistors), the following expression is obtained:
This, in turn, leads to:
Since R_SENSE is known, measuring the voltage drop across R_SENSE may determine the current. With the output voltage V_0 set to 1V (DAC0 OUT) and using the resistor values as listed, the following result is obtained:
MPLAB version:
MCC Core v5.5.0 or newer
Microchip Studio for AVR and SAM Devices v7.0.2542 or newer
For debugging purposes, it can be helpful to install the MPLAB Data Visualizer:
The hardware setup is explained in the Hardware Diagram section above.
The AVR EA device is configured to stay in Power-Down sleep mode whenever a measurement is not in progress to minimize power consumption.
The Periodic Interrupt Timer (PIT), a part of the Real Time Counter (RTC), is set up to generate an interrupt each second to bring the device out of sleep mode. When this happens, a counter is incremented and checked against a predefined period (10s).
If the value matches this period, the DAC is enabled to produce an output voltage of 1.0V, and the ADC is enabled. The ADC is commanded to start a differential conversion immediately. While the ADC conversion is in progress, the CPU performs the calculations necessary for converting the previous ADC value into a voltage and a current. After the ADC conversion is complete, the DAC and ADC are disabled, and the device goes back into sleep mode.
In the example code, USART1 can be used to output the measured voltage and calculated current to a terminal. The “#define USART_ON” must be included to enable this.
When measuring small signals, the PGA may be enabled to amplify the input signal to get better resolution on the measurement. In this example, the PGA gain is set to 16x. The PGA bias is set to the maximum of 100%, because the highest bias allows the ADC sampling duration to be minimized (see device datasheet).
The following table shows the average current consumptions using different configurations (with V_DD = 3.3V):
| Main Clock | PGA Disabled (ADC), Average Current | PGA Enabled (ADC), Average Current (uA) |
|---|---|---|
| 2 MHz | 1.7 uA | 1.6 uA |
| 3.33 MHz | 1.4 uA | 1.3 uA |
| 10 MHz | 1.2 uA | 1.1 uA |
The average current consumption with the PGA enabled was lower than when the PGA was off, not following the theoretically expected result that using the PGA should result in higher current consumption. Testing showed that by not entering sleep and sampling the ADC on each interrupt (each second) with the main clock at 10 MHz, the results were as expected:
| PGA (ADC) | Average Current Consumption |
|---|---|
| PGA OFF | 3.48 mA |
| PGA ON | 3.50 mA |
This suggests that the higher average current consumption measured when PGA is off compared to when the PGA is enabled in the initial measurement is due to a combination of the time between each ADC measurement and the code execution order.
The key peripherals and parameters used in the source code are:
The following figure shows the high-level flow of the code:

Figure 3. High-level flow of current sensing code
MPLAB Discover bundles the available resources from multiple sources into one portal. The MPLAB Discover webpage: MPLAB Discover

You can download code examples as a .zip file directly from MPLAB Discover. Repositories ending with “studio” can be opened in Microchip Studio. Repositories ending with “mplab-mcc” can be opened in MPLAB X.
When the code example is hosted on GitHub, MPLAB Discover provides a link “Open with Github”. There you can download the example code or use the git tool on your PC to create a local repository clone.